Build aesthetics to use in a plot
Examples
# Classic
build_aes(iris, x = "Sepal.Width")
#> Aesthetic mapping:
#> * `x` -> `Sepal.Width`
build_aes(iris, x = "Sepal.Width", y = "Sepal.Width")
#> Aesthetic mapping:
#> * `x` -> `Sepal.Width`
#> * `y` -> `Sepal.Width`

# Explicit geom : no change
build_aes(iris, x = "Species", geom = "bar")
#> Aesthetic mapping:
#> * `x` -> `Species`

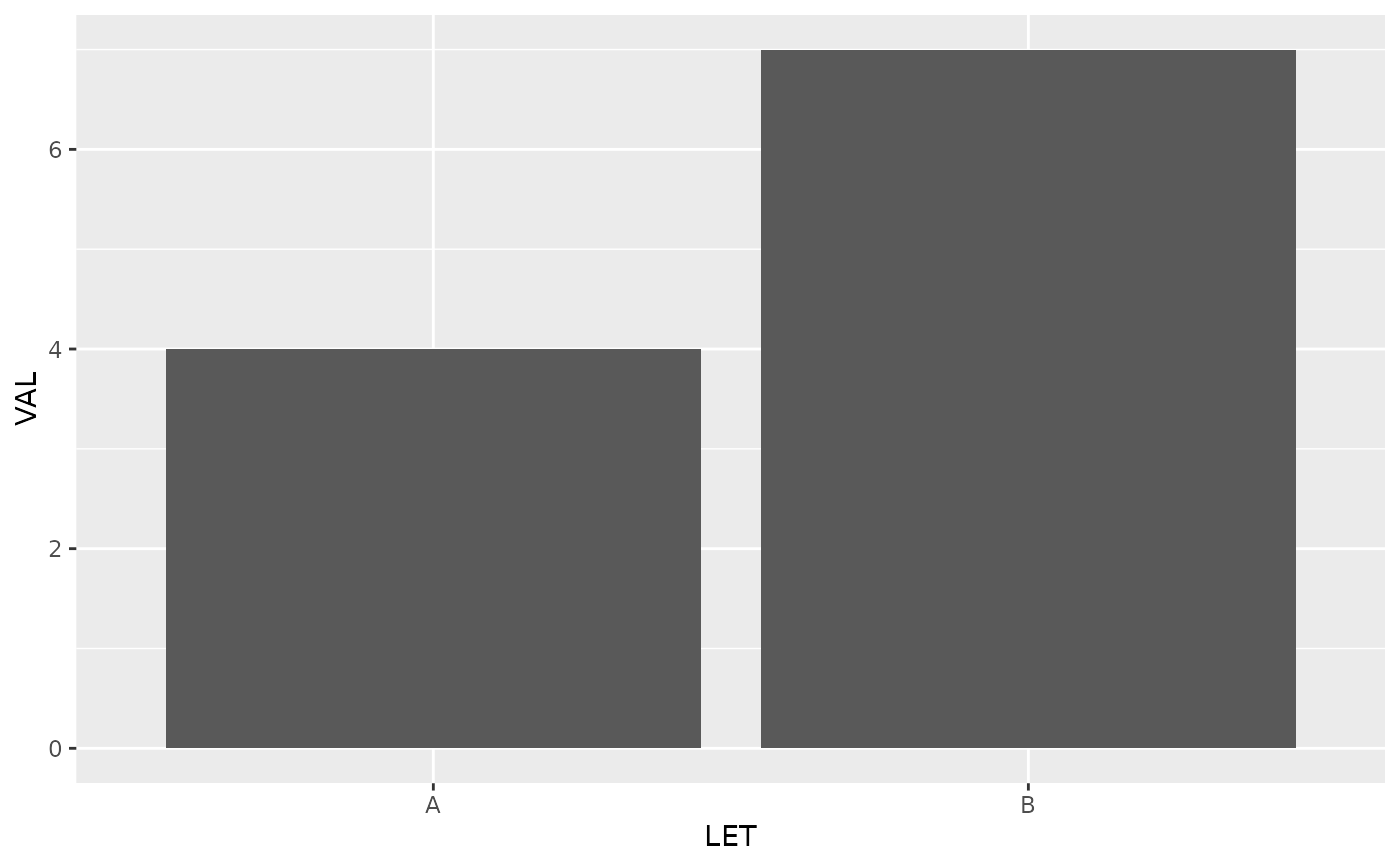
# Little trick if data is count data
df <- data.frame(
  LET = c("A", "B"),
  VAL = c(4, 7)
)
build_aes(df, x = "LET", y = "VAL", geom = "bar")
#> Aesthetic mapping:
#> * `x` -> `LET`
#> * `y` -> `VAL`

# e.g. :
library(ggplot2)
ggplot(df) +
  build_aes(df, x = "LET", y = "VAL", geom = "bar") +
  geom_bar(stat = "summary", fun = "mean")

