vchartr
vchartr.RmdInstallation
You can install the development version of vchartr from GitHub with:
# install.packages("remotes")
remotes::install_github("dreamRs/vchartr")
Overview
The following graphs (and more) can be produced:
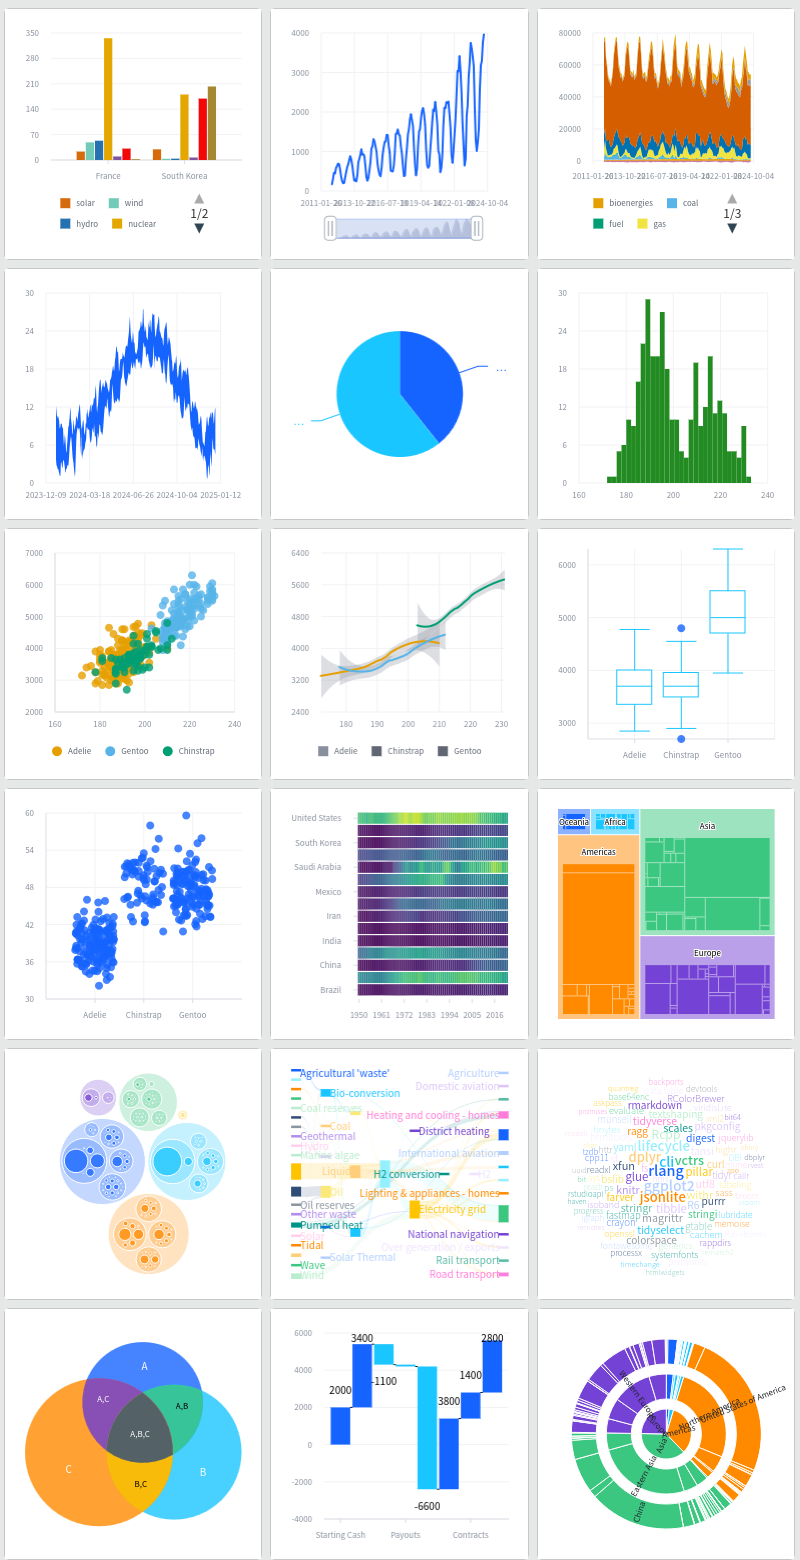
charts-overview
See the JavaScript library website for more examples and documentation.
Interactive examples are available here: https://dreamrs.github.io/vchartr/articles/charts.html.
Usage
Start by initializing a chart with the vchart()
function, then choose the appropriate function according to the type of
chart you wish to make and specify the variables to be used as
aesthetics:
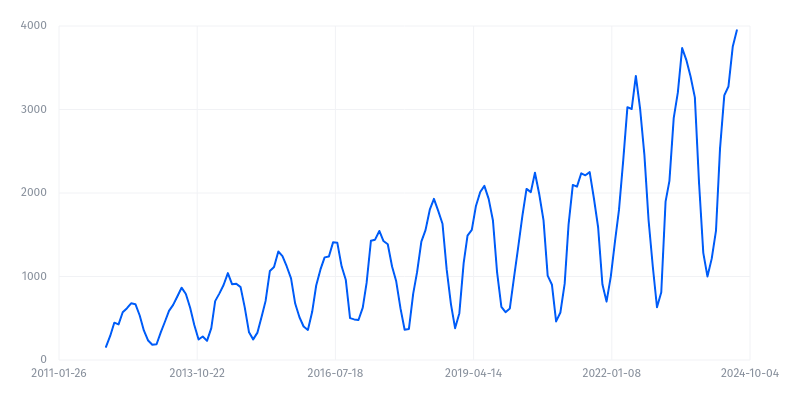
v_line
Modify scales options for aesthetics with v_scale_*
functions:
vchart(eco2mix) %>%
v_line(aes(date, solar)) %>%
v_scale_x_date(
date_breaks = "2 years",
date_labels = "MM-YYYY",
name = "Date"
) %>%
v_scale_y_continuous(
labels = "~s",
name = "Electricity generation"
)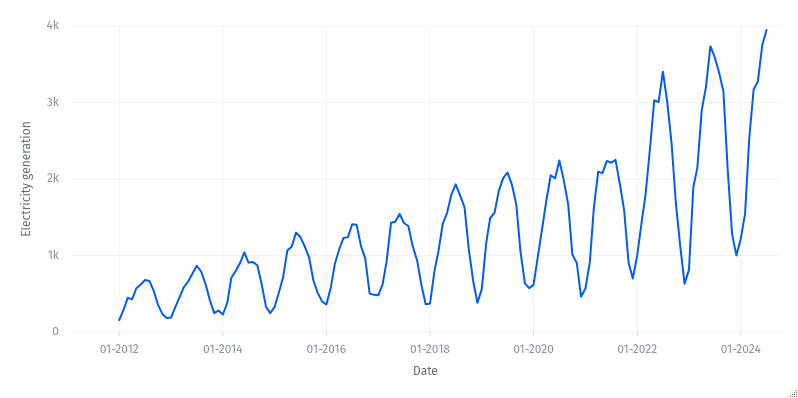
v_scales
Set any options with v_specs (see all options available
here):
vchart(eco2mix) %>%
  v_line(aes(date, solar)) %>%
  v_specs(
    brush = list(
      brushType = "x",
      zoomAfterBrush = TRUE
    ),
    dataZoom = list(
      orient = "bottom",
      startText = list(formatter = "{label:%Y-%m-%d}"),
      endText = list(formatter = "{label:%Y-%m-%d}")
    )
  )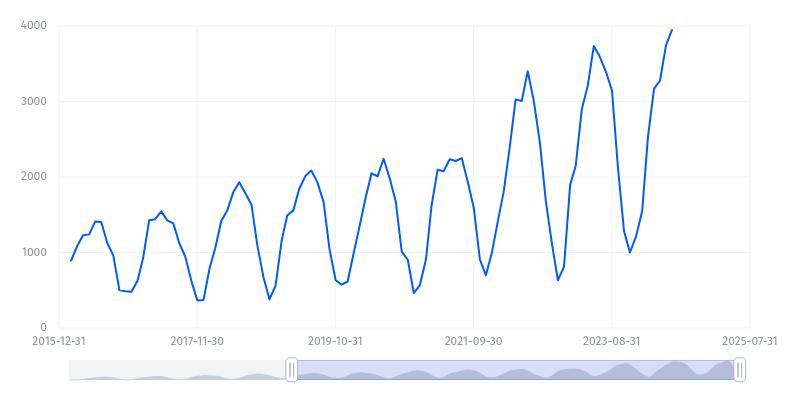
v_specs
Or use v_specs_* helpers: