{flextable} extension to create ready-to-use frequency tables in shiny and rmarkdown, and easily exportable to Word, PowerPoint and Excel.
Installation
You can install the development version of {flexpivot} from GitHub with:
remotes::install_github("dreamRs/flexpivot")Example
library(flexpivot)
library(magrittr)

nobel_laureates %>%
  subset(category %in% c("Chemistry", "Physics")) %>%
  pivot_table("category", "gender") %>%
  pivot_format()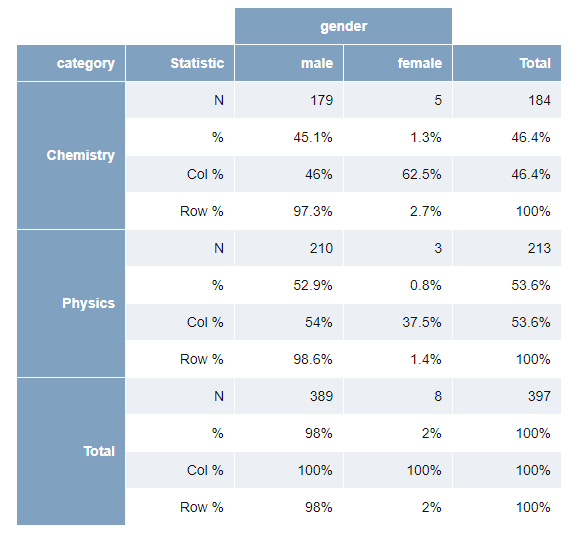
More examples available in the vignette : https://dreamrs.github.io/flexpivot/articles/flexpivot.html
Related packages
- crosstable & crosstableAssistant makes it easy to calculate descriptive statistics and export them into Office and has a nice Shiny app to create tables interactively.