flexpivot
flexpivot.RmdCreate contingency tables ready to be used in shiny and rmarkdown, and to be exported to Microsoft Office products via package officer.
Usage
Get count and percentage with one variable:
nobel_laureates %>%
  pivot_table("category") %>%
  pivot_format()
category |
N |
% |
|---|---|---|
Chemistry |
184 |
19.4% |
Economic Sciences |
84 |
8.8% |
Literature |
116 |
12.2% |
Peace |
134 |
14.1% |
Physics |
213 |
22.4% |
Physiology or Medicine |
219 |
23% |
Total |
950 |
100% |
Add a second variable as row or col :
nobel_laureates %>%
  pivot_table("category", "gender") %>%
  pivot_format()
gender |
|||||
|---|---|---|---|---|---|
category |
Statistic |
male |
female |
<missing> |
Total |
Chemistry |
N |
179 |
5 |
0 |
184 |
% |
18.8% |
0.5% |
0% |
19.4% |
|
Col % |
20.6% |
9.3% |
0% |
19.4% |
|
Row % |
97.3% |
2.7% |
0% |
100% |
|
Economic Sciences |
N |
82 |
2 |
0 |
84 |
% |
8.6% |
0.2% |
0% |
8.8% |
|
Col % |
9.4% |
3.7% |
0% |
8.8% |
|
Row % |
97.6% |
2.4% |
0% |
100% |
|
Literature |
N |
101 |
15 |
0 |
116 |
% |
10.6% |
1.6% |
0% |
12.2% |
|
Col % |
11.6% |
27.8% |
0% |
12.2% |
|
Row % |
87.1% |
12.9% |
0% |
100% |
|
Peace |
N |
90 |
17 |
27 |
134 |
% |
9.5% |
1.8% |
2.8% |
14.1% |
|
Col % |
10.4% |
31.5% |
100% |
14.1% |
|
Row % |
67.2% |
12.7% |
20.1% |
100% |
|
Physics |
N |
210 |
3 |
0 |
213 |
% |
22.1% |
0.3% |
0% |
22.4% |
|
Col % |
24.2% |
5.6% |
0% |
22.4% |
|
Row % |
98.6% |
1.4% |
0% |
100% |
|
Physiology or Medicine |
N |
207 |
12 |
0 |
219 |
% |
21.8% |
1.3% |
0% |
23% |
|
Col % |
23.8% |
22.2% |
0% |
23% |
|
Row % |
94.5% |
5.5% |
0% |
100% |
|
Total |
N |
869 |
54 |
27 |
950 |
% |
91.5% |
5.7% |
2.8% |
100% |
|
Col % |
100% |
100% |
100% |
100% |
|
Row % |
91.5% |
5.7% |
2.8% |
100% |
|
nobel_laureates %>%
  pivot_table(c("category", "gender"), total = FALSE) %>%
  pivot_format()
category |
gender |
N |
% |
|---|---|---|---|
Chemistry |
male |
179 |
18.8% |
female |
5 |
0.5% |
|
<missing> |
0 |
0% |
|
Economic Sciences |
male |
82 |
8.6% |
female |
2 |
0.2% |
|
<missing> |
0 |
0% |
|
Literature |
male |
101 |
10.6% |
female |
15 |
1.6% |
|
<missing> |
0 |
0% |
|
Peace |
male |
90 |
9.5% |
female |
17 |
1.8% |
|
<missing> |
27 |
2.8% |
|
Physics |
male |
210 |
22.1% |
female |
3 |
0.3% |
|
<missing> |
0 |
0% |
|
Physiology or Medicine |
male |
207 |
21.8% |
female |
12 |
1.3% |
|
<missing> |
0 |
0% |
Customize
Change color and labels :
nobel_laureates %>%
  pivot_table("category") %>%
  pivot_format(
    background = "#D8DEE9",
    color = "#3B4252",
    labels = pivot_labels(
      n = "Count",
      p = "Percentage",
      rows = "Nobel category"
    )
  )
Nobel category |
Count |
Percentage |
|---|---|---|
Chemistry |
184 |
19.4% |
Economic Sciences |
84 |
8.8% |
Literature |
116 |
12.2% |
Peace |
134 |
14.1% |
Physics |
213 |
22.4% |
Physiology or Medicine |
219 |
23% |
Total |
950 |
100% |
Export
Export pivot table to Word, PowerPoint or Excel:
pt <- pivot_table(
  data = nobel_laureates,
  "category", "gender",
  total = FALSE,
  stats = c("n", "p")
)

# PowerPoint
export_pptx(pt, "my-presentation.pptx")

# Word
export_docx(pt, "my-document.docx")

# Excel
export_xlsx(pt, "my-workbook.xlsx")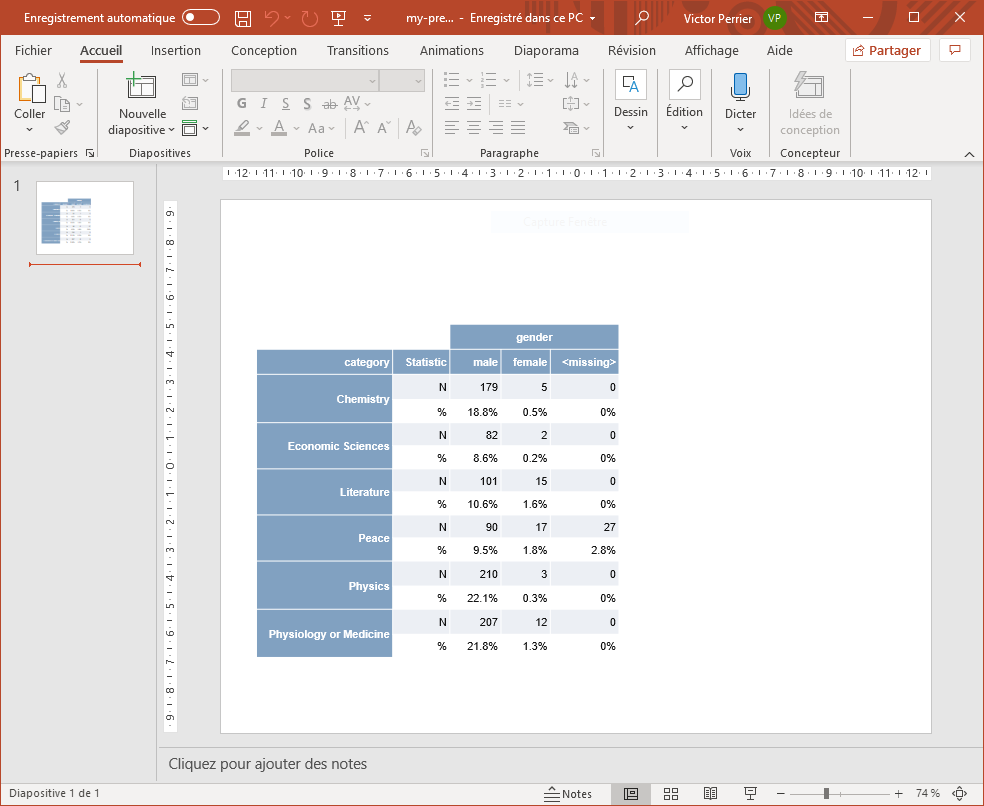
Shiny
Use in shiny with pivotOutput() and
renderPivot(), a menu is automatically added to export the
pivot table (can be disabled or allow specific export to):
library(shiny)
library(flexpivot)
data("nobel_laureates")

ui <- fluidPage(
  tags$h2("Pivot table in Shiny"),
  pivotOutput("pivot")
)

server <- function(input, output, session) {

  output$pivot <- renderPivot({
    pivot_table(nobel_laureates, "category", "birth_continent", stats = c("n", "p"))
  }, background = "#A3BE8C")

}

shinyApp(ui, server)