
rmarkdown usage
rmarkdown.Rmdgrillade()
You can use grillade() in an rmarkdown::html_document() to combine multiple {htmlwidgets}, here an example with the {apexcharter} package :
a1 <- apex(
  data = tail(economics, 350),
  mapping = aes(x = date, y = uempmed),
  type = "line"
)
a2 <- apex(
  data = tail(economics, 350),
  mapping = aes(x = date, y = psavert),
  type = "line"
)

grillade(a1, a2)
With fenced Div
If you want to create columns with content other than something that produce HTML, you can use fence div, but before that you have to load grillade HTML dependencies like that :
# Loading grillade
use_grillade()
After that, use :::: {.autogrid .has-gutter} to start the grillade (automatic number of columns with a gutter between them) and ::: {} to delimit columns:
Code is :
:::: {.autogrid .has-gutter}
::: {}
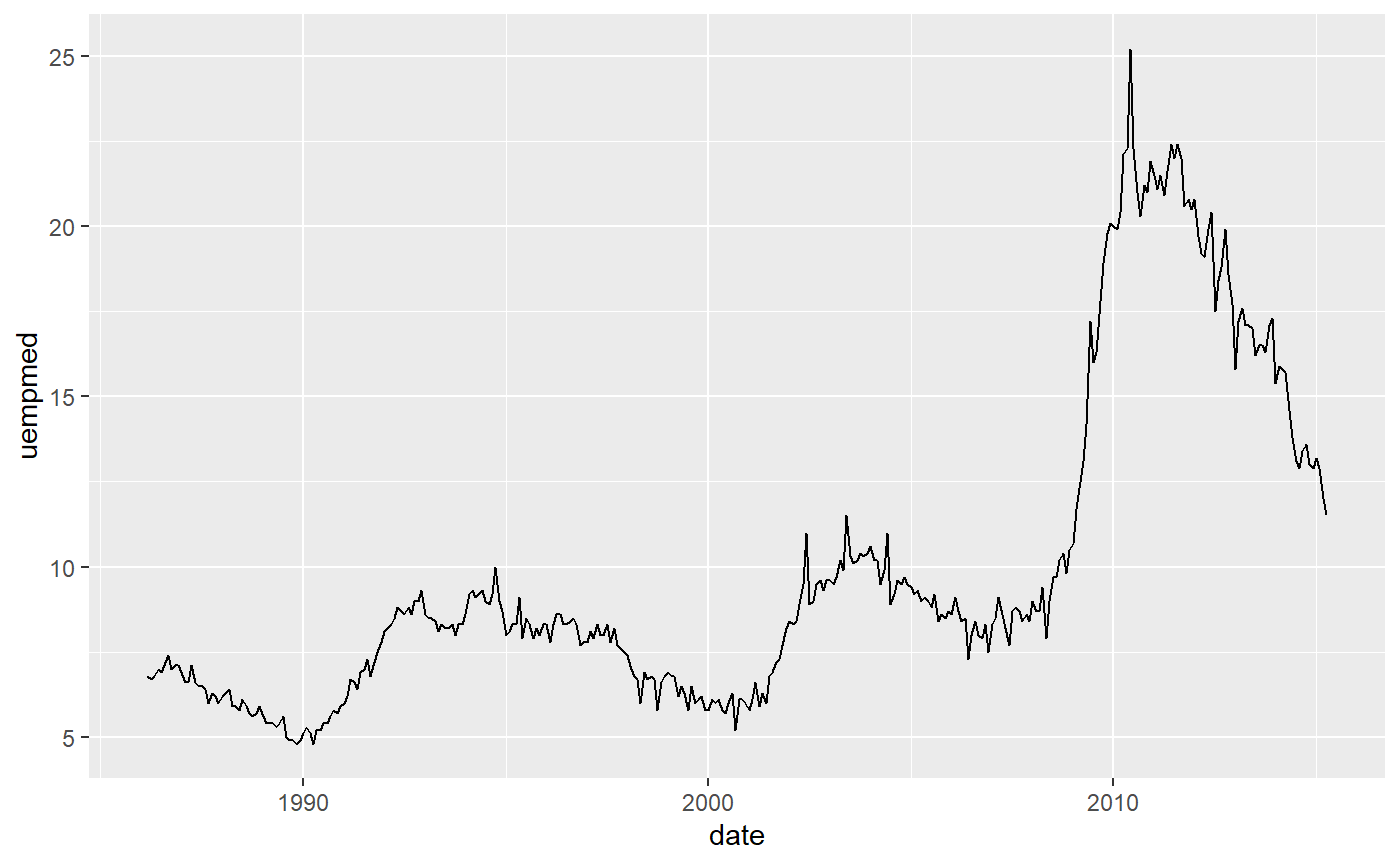
First plot:
```r
ggplot(tail(economics, 350)) +
  geom_line(aes(x = date, y = uempmed))
```
:::
::: {}
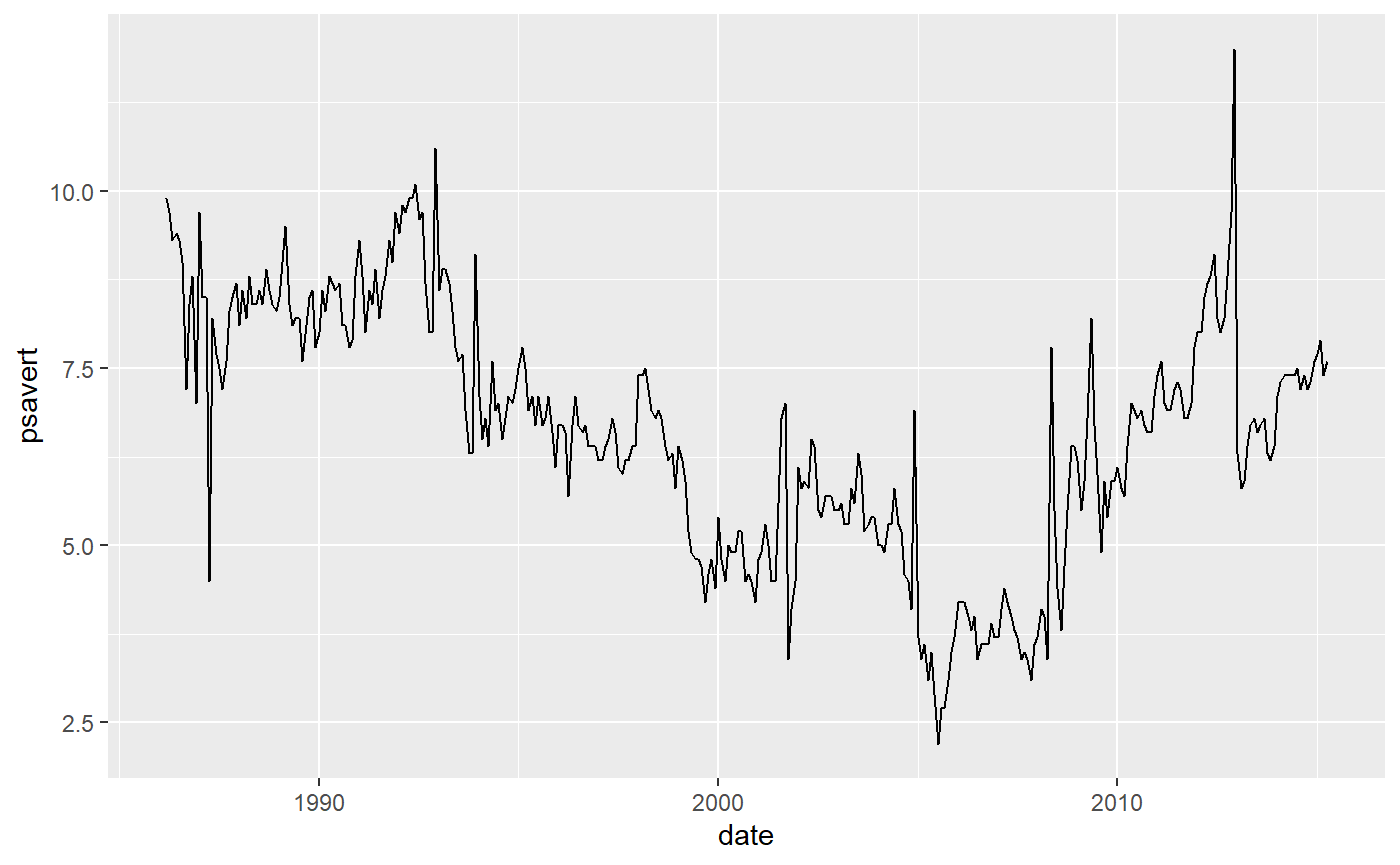
Second plot on the left:
```r
ggplot(tail(economics, 350)) +
  geom_line(aes(x = date, y = psavert))
```
:::
::::