Htmlwidget for apexcharts.js : A modern JavaScript charting library to build interactive charts and visualizations with simple API. See the online documentation for examples.
Installation
Install from CRAN with:
install.packages("apexcharter")Or install the development version from GitHub with:
# install.packages("remotes")
remotes::install_github("dreamRs/apexcharter")
Quick Charts
Use apex function to quickly create visualizations :
library(apexcharter)
data("mpg", package = "ggplot2")
apex(data = mpg, type = "bar", mapping = aes(manufacturer))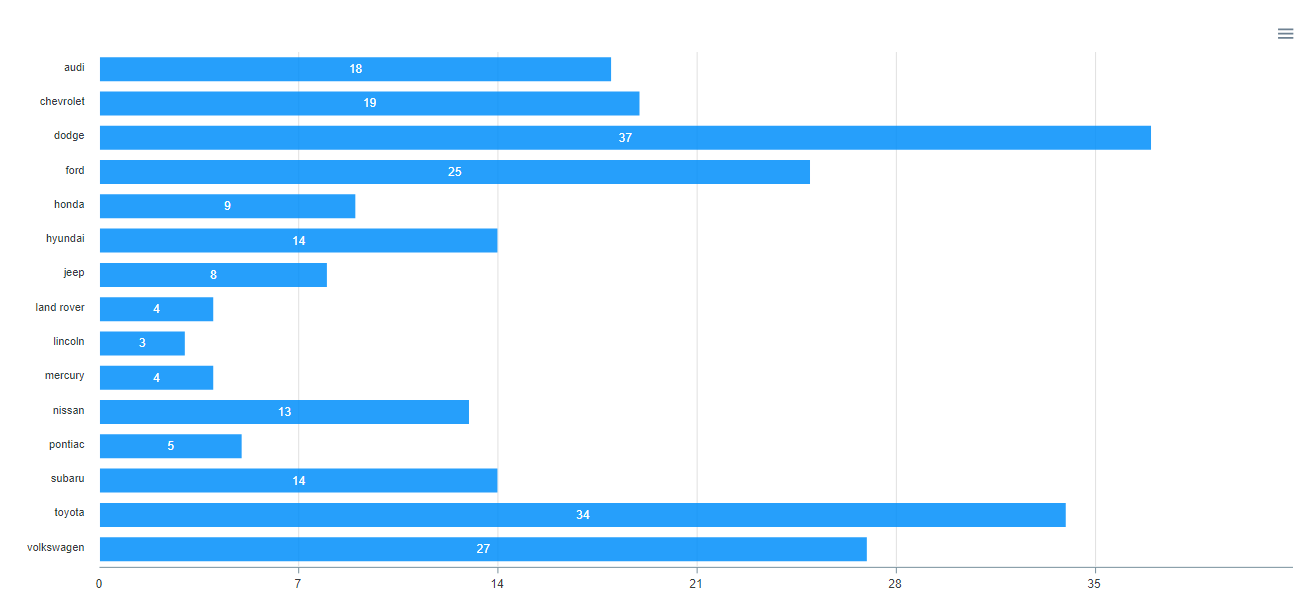
With datetime:
data("economics", package = "ggplot2")
apex(data = economics, type = "line", mapping = aes(x = date, y = uempmed)) %>%
  ax_stroke(width = 1)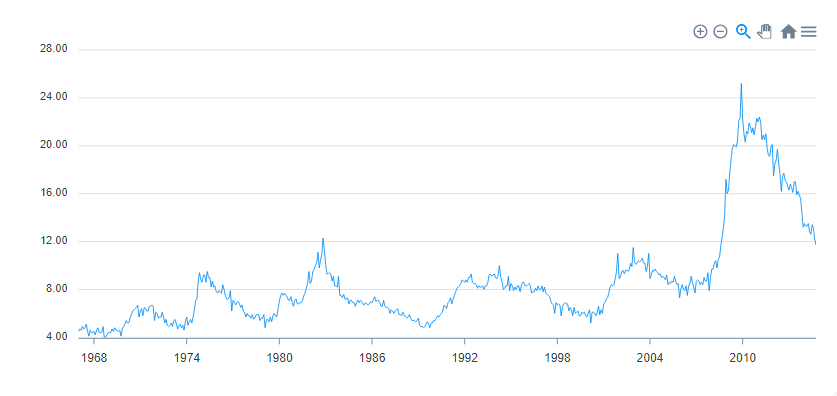
Full API
All methods from ApexCharts are available with function like ax_* compatible with pipe from magrittr :
library(apexcharter)
data(mpg, package = "ggplot2")

apexchart() %>%
  ax_chart(type = "bar") %>%
  ax_plotOptions(bar = bar_opts(
    horizontal = FALSE,
    endingShape = "flat",
    columnWidth = "70%",
    dataLabels = list(
      position = "top"
    ))
  ) %>%
  ax_grid(
    show = TRUE,
    position = "front",
    borderColor = "#FFF"
  ) %>%
  ax_series(list(
    name = "Count",
    data = tapply(mpg$manufacturer, mpg$manufacturer, length)
  )) %>%
  ax_colors("#112446") %>%
  ax_xaxis(categories = unique(mpg$manufacturer)) %>%
  ax_title(text = "Number of models") %>%
  ax_subtitle(text = "Data from ggplot2")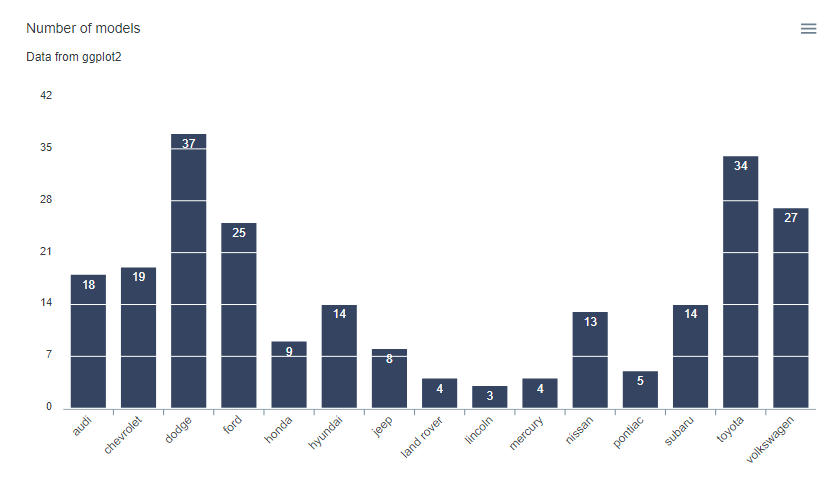
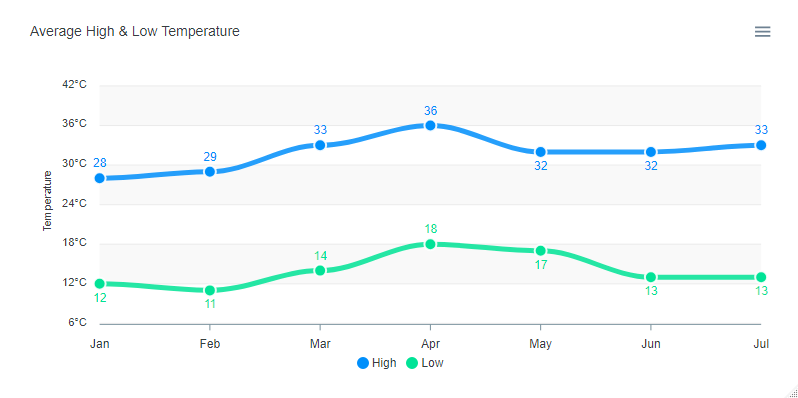
Raw API
Pass a list of parameters to the function:
apexchart(ax_opts = list(
  chart = list(
    type = "line"
  ),
  stroke = list(
    curve = "smooth"
  ),
  grid = list(
    borderColor = "#e7e7e7",
    row = list(
      colors = c("#f3f3f3", "transparent"),
      opacity = 0.5
    )
  ),
  dataLabels = list(
    enabled = TRUE
  ),
  markers = list(style = "inverted", size = 6),
  series = list(
    list(
      name = "High",
      data = c(28, 29, 33, 36, 32, 32, 33)
    ),
    list(
      name = "Low",
      data = c(12, 11, 14, 18, 17, 13, 13)
    )
  ),
  title = list(
    text = "Average High & Low Temperature",
    align = "left"
  ),
  xaxis = list(
    categories = month.abb[1:7]
  ),
  yaxis = list(
    title = list(text = "Temperature"),
    labels = list(
      formatter = htmlwidgets::JS("function(value) {return value + '\u00b0C';}")
    )
  )
))
Development
This package use {packer} to manage JavaScript assets, see packer’s documentation for more.
Install nodes modules with:
packer::npm_install()Modify srcjs/widgets/apexcharter.js, then run:
packer::bundle()Re-install R package and try apexcharter() or apex() functions.